Interactive Map
The interactive map of the 2025 road safety record lets you visualize statistics related to automobile accidents, detailed by Québec region, regional county municipality (MRC) or municipality (5,000 or more inhabitants). The map is available in French only. The data used in the interactive map are based on the accident reports filled out by police officers following accidents that occurred in 2025 and that were reported to the SAAQ before March 10, 2026.
Using the map
Tabs
Seven tabs are available above the map:
- Number of accidents
- Number of deaths
- Fatalities per 100,000 inhabitants
- Number of accident victims
- Accident victims per 100,000 inhabitants
- Number of pedestrian victims
- Number of motorcyclist victims
Key
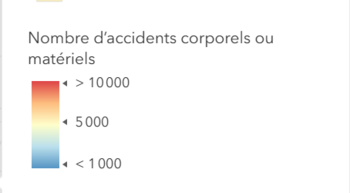
The key is located in the lower right corner of the map and can be clicked open and shut. It shows the territorial division currently displayed on the map (region, regional county municipality (MRC) or municipality), as well as the statistics associated with each shade on the map, depending on the selected road safety indicator.
Search
![]()
The search tool lets you find a specific location or address on the map. Click on the magnifying glass and enter the place you are looking for, such as an MRC, municipality or address, in the box.
Zoom
![]()
The zoom feature lets you adjust the map’s display. The + button zooms into the map (bringing you nearer), the – button zooms out of the map (bringing you farther out) and the house icon brings you back to the initial map.
Tooltip

When you click on an administrative region, an MRC or a municipality on the map, a tooltip appears and details the road safety indicators pertaining to the selected territory. These indicators are:
- Number of accidents
- Number of accident victims
- Number of fatalities
- Number of victims who sustained serious injuries
- Number of victims who sustained minor injuries
- Accident victims per 100,000 inhabitants
- Fatalities per 100,000 inhabitants
- Victims with serious injuries per 100,000 inhabitants
- Victims with minor injuries per 100,000 inhabitants
- Number of pedestrian victims
- Number of motorcyclist victims
Web browser
This website complies with Web standards and is generally accessible using the most common Web browsers. However, its appearance may differ from one browser to another. For the best experience, we recommend that you use a recent browser.
Email your questions or comments regarding the interactive map to cartographie@saaq.gouv.qc.ca This link opens your default email software..
Last update: June 12, 2026